Meta-analysis is a subset of systematic reviews that combines pertinent qualitative and quantitative study data from several selected studies to develop a single conclusion with greater statistical power. In this article we focus more on general framework of meta-analysis and a detailed perspective on designing meta-analysis including the five-step process.

Meta-analysis is a subset of systematic reviews that combines pertinent qualitative and quantitative study data from several selected studies to develop a single conclusion with greater statistical power. This conclusion is statistically more significant than the analysis of any single research due to increased numbers of subjects, greater diversity among subjects, or accumulated effects and results. In simple words, meta-analysis is the statistical combination of results from two (02) or more separate studies.
Studies comparing healthcare interventions, notably randomised trials, use the outcomes of participants to compare the effects of different interventions. Meta-analyses focus on pair-wise comparisons of interventions. The contrast between the outcomes of two (02) groups treated differently is known as the ‘effect’ - the ‘treatment effect’ or the ‘intervention effect.’ The analysis of the included studies is either narrative or quantitative.
The general framework for meta-analysis may be provided by considering the following four (04) questions:
Meta-analysis provides a statistical method for questions 1 to 3. Assessment of question 4. relies additionally on judgments based on assessments of study design and risk of bias, as well as statistical measures of uncertainty.
On the other hand, narrative synthesis uses subjective (rather than statistical) methods to follow through questions 1 to 4 for reviews where meta-analysis is either not feasible or not sensible.
Purpose
Advantages
Disadvantages
A clinical research question is identified, and a hypothesis is proposed. The likely clinical significance is explained, and the study design and analytical plan are justified.
Usually, two (02) standard tools are used: Patient, Intervention, Comparison, Outcome (PICO) or Sample, Phenomenon of Interest, Design, Evaluation, and Research type (SPIDER). PICO is primarily used in quantitative evidence synthesis. The authors demonstrated that the PICO holds more sensitivity than the more specific SPIDER approach. The latter was proposed as a method for qualitative and mixed method searches.
PICO is typically used for systematic review and meta-analysis of clinical trial studies.
PICO stands for:
P – Population: patient, or problem: How do you describe the patients, people, or problems you are looking at?
I – Intervention: What is considered an intervention, exposure, or a factor?
C – Comparison: Do you have something to compare to the intervention, exposure, or factor you are considering?
O – Outcome: What is hoping to measure, improve, affect, or accomplish?
The protocol “outlines how the review authors will handle the review process and the challenge they are addressing. The procedure describes how the studies in the review were identified, assessed, and summarised. The protocol serves as a public record of how the review authors aim to address their research question by making this information available.”
In addition to serving as a road map for the research question, protocols also allow the individual to comprehend what type of research is performed and helps avoid duplication of research.
a) Identification of Literature Search Database (Registries, Repositories, or Libraries)
Most frequently used databases are as follows:
This list covers almost all the published articles in tropical medicine and other health-related fields.
b) Search for Relevant Literature (Reported and New Studies) Using a String-based Search on the Research Question
The search process needs to be documented in enough detail to ensure that it can be reported correctly in the review to the extent that all the databases’ searches are reproducible. The search strategies will need to be copied and pasted exactly as run and included in full, together with the search set numbers and the number of records retrieved. The search strategy should emphasise on:
c) Collection of All the Retrieved Literature Using Reference Management Tools
Specially designed bibliographic or reference management software such as Mendeley, EndNote, ProCite, Reference Manager, and RefWorks are helpful and relatively easy to use to keep track of references and report studies.
d) Determination of Inclusion and Exclusion Criteria Based on Eligibility Criteria
The PICO strategy, study design, and deadline determine eligibility criteria. Most exclusion criteria are irrelevant, duplicate, unavailable, or abstract-only papers. These exclusions should be specified in advance to prevent bias from the researcher. The inclusion criteria would include publications containing the target patients, researched interventions, or comparing two (02) evaluated interventions.
In brief, they would contain material pertinent to the study subject. Most importantly, the information should be clear and sufficient to answer the positive or negative issue.
e) Identification of Supporting Studies and Finalising the Articles to be Included
For many authors, the appearance of a diamond (statistical analysis) at the bottom of a plot is an exciting moment, but the results of meta-analyses can be extremely misleading if adequate attention is not compensated to formulating the review question, specifying eligibility criteria, identifying, selecting, and critically evaluating studies, collecting appropriate data, and deciding what would be meaningful to analyse.
f) Reporting the Search Process
The search process must be recorded in precise detail to ensure that it can be reported accurately in the review, to the extent that all searches of all databases can be reproduced. The search techniques must be carefully copied and pasted, together with the search set numbers and the total number of records retrieved.

Once the studies are selected for inclusion in the meta-analysis, summary data or outcomes are extracted from each study. In addition, sample sizes and measures of data variability for both intervention and control groups are required. Depending on the study and the research question, outcome measures could include numerical or categorical measures. For example, differences in scores on a questionnaire or measurement level, such as blood pressure, would be reported as a numerical mean. However, differences in the likelihood of being in one (01) category versus another (e.g., vaginal birth versus cesarean birth) are usually reported in terms of risk measures such as odds ratio or relative risk.
a) Data Extraction for Dichotomous Outcomes: It is most reliable to collect dichotomous outcome data as the number of individuals in each group who did and did not experience the result. Although, in theory, this is comparable to collecting both the total number of individuals and the number of individuals sharing the outcome and it is not always apparent if the total number of individuals reported is the number of individuals on whom the outcome was assessed. Occasionally, the numbers incurring the event need to be derived from percentages.
b) Data Extraction for Continuous Outcomes: Due to inadequate and inconsistent reporting, it may be difficult or impossible to obtain the required information from the provided data summaries. Additionally, they differ in the scale used to analyse the data. In a research report, standard deviations and standard errors are occasionally conflated, and the nomenclature needs to be more consistently applied. When necessary, the authors must always request missing information and clarification about the reported statistics. Nevertheless, there is an approximate or direct algebraic link between numerous variance measures and the standard deviation.
c) Data Extraction for Ordinal Outcomes: The retrieved data for ordinal outcomes depends on whether the ordinal scale will be dichotomised for analysis, treated as a continuous outcome, or analysed directly as ordinal data. In turn, this choice will be influenced by how the authors of the studies analysed their data. The strategy of capturing all the categorisation is also useful when studies utilise somewhat different short ordinal scales. Whether a consistent cut-point can be used for dichotomisation across all studies is uncertain.
d) Data Extraction for Counts: Count data can be analysed in various ways. The crucial option is whether the interesting outcome should be dichotomous, continuous, time-to-event, or a rate. A typical error is treating counts directly as dichotomous data, considering the total number of participants or person-years of follow-up as sample sizes. Though it is preferred to decide how count data will be analysed in advance, the option is frequently driven by the structure of the available data and cannot be made until most studies have been reviewed.
e) Data Extraction for Time-to-Event Outcomes: Meta-analysis of time-to-event data typically involves obtaining individual patient data from the original investigators, reanalysing the data to estimate the log hazard ratio and its standard error, and then conducting a meta-analysis. Whether individual patient or aggregate data are used, there are two (02) approaches to get estimates of log hazard ratios and associated standard errors for inclusion in a meta-analysis that employs generic inverse variance methods.
f) Data Extraction for Effects Estimates: When extracting data from non-randomised studies and some randomised trials, it may be possible to obtain adjusted effect estimates. The process of data extraction and analysis using the generic inverse variance approach is identical to that for unadjusted forecasts; however, the variables that have been corrected must be noted. The disadvantage of this approach is that the estimates and standard errors for the same effect measure must be produced for every other study included in the same meta-analysis, even if they provide summary data per intervention group.
Heterogeneity: A systematic review will assemble studies with varying results. Heterogeneity is a term for any variation between research in a systematic review. Differentiating between various types of heterogeneity (clinical, methodological, and statistical) can be beneficial. Specifically, heterogeneity related only to methodological variety would indicate the studies are biased to varying degrees. Explorations of heterogeneity designed after identifying heterogeneity can only result in the development of hypotheses. They should be evaluated with much greater caution and normally should not be included among the review findings.
Methods for tackling clinical heterogeneity should be mentioned, along with how the authors will assess whether a meta-analysis is acceptable. Methods for spotting statistical heterogeneity should be described (e.g., visually, utilising I, etc.) using the chi-squared test.
Publication Bias: The publication or non-publication of research findings may be influenced by publication bias based on the type and direction of the results. There are two (02) types of scientific studies that investigate the existence of publication bias - indirect and direct evidence. As the proportion of all hypotheses tested for which the null hypothesis is false is unknown, surveys of published results such as those mentioned above, can only give indirect evidence of publication bias. There are also considerable direct indications of publishing bias.
Publication bias should be viewed as one of the potential sources of ‘small-study effects’ — the tendency for intervention effect estimates to be more positive in smaller trials. Using funnel plots, review authors can visually determine whether small-study effects may be present in a meta-analysis.
Funnel plots: A funnel plot is a basic scatter plot of the intervention effect estimates from individual studies versus a measure of each study's size or precision.
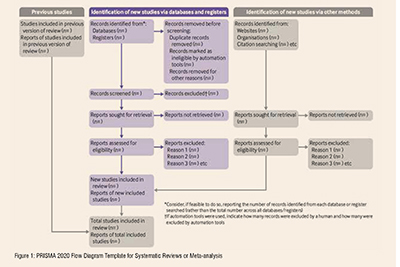
A PRISMA flowchart template is presented, which can be adjusted based on whether the systematic review or a meta-analysis is original or updated (figure 1).
The final stage is to select and apply an appropriate model to compare Effect Sizes across different studies. The most common models used are Fixed Effects and Random Effects models. Fixed Effects models are based on the ‘assumption that every study is evaluating a common treatment effect.’ This means that the assumption is that all studies would estimate the same Effect Size were it not for different levels of sample variability across various studies. In contrast, the Random Effects model ‘assumes that the true treatment effects in the individual studies may be different from each other’ and attempts to allow for this additional source of interstudy variation in Effect Sizes. Whether this latter source of variability is likely important is often assessed within the meta-analysis by testing for ‘heterogeneity.’
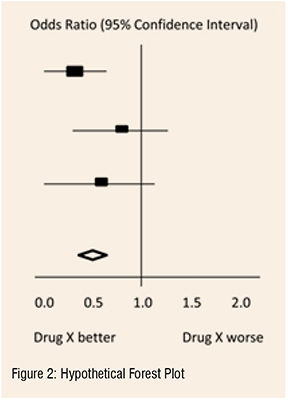
The final estimates from a meta-analysis are often graphically reported as a ‘Forest Plot.’ A forest plot displays effect estimates and confidence intervals for individual studies and meta-analyses. The standard method for illustrating individual research outcomes and meta-analyses uses forest plots. These can be generated with the Review Manager software, and a selection of them can be chosen for inclusion.
Forest plots and funnel plots from the ‘data and analysis’ section may be chosen as figures for inclusion in an integrated section. Forest plots describe all the studies, and study data for the principal outcomes will be presented as figures. A funnel plot for one (01) or more key outcomes may be a vital contributor to these forest plots if there are sufficient studies.

In the hypothetical forest plot shown in Figure 2, for each study, a horizontal line indicates the standardised Effect Size estimate (the rectangular box in the center of each line) and 95% CI for the risk ratio used. For each of the studies, drug X reduced the risk of death (the risk ratio is less than 1.0). However, the first study was larger than the other two (the size of the boxes represents the relative weights calculated by the meta-analysis). Perhaps, because of this, the estimates for the two (02) smaller studies were not statistically significant (the lines emanating from their boxes include the value of 1.0). When all three (03) studies were combined in the meta-analysis as represented by the diamond, we get a more precise estimate of the drug’s effect, where the diamond represents both the combined risk ratio estimate and the limits of the 95 per cent CI.
The drafting of a manuscript is based on the guidelines of the ICMJE, i.e., the IMRaD model’s four (04) scientific sections: introduction, methods, results, and discussion, mainly with a conclusion. Performing a characteristic table for study and patient characteristics is a mandatory step that includes a detailed search strategy for database searches. Figure 2
After completing the manuscript draft, characteristics table, and PRISMA flow diagram, the draft should be sent out for review. Finally, a suitable journal with a significant impact factor and a relevant field should be chosen for the manuscript. Before submitting the manuscript, we must pay close attention to the author guidelines of the journals.
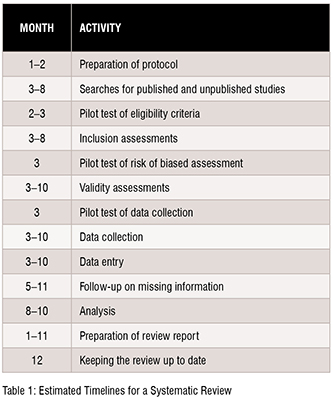
The time required to complete a systematic review is highly variable. However, considering the tasks and the time required for each of these might aid the authors in estimating the amount of time needed. Tasks include protocol development, searching for studies, evaluating citations, and full-text reports of studies for eligibility, assessing the risk of bias in included studies, collecting data, pursuing missing data and unpublished studies, analysing the data, interpreting the results, and writing the review, as well as keeping the review up to date as shown in Table 1.
The reliability of meta-analysis findings is mainly determined by the quality of the data used for the compilation. The steps in this process include developing a research question and validating it, forming criteria, developing a search strategy, searching databases, importing all results to a library and exporting them to an excel sheet, protocol writing and registration, title and abstract screening, full-text screening, manual searching, extracting data and assessing its quality, data checking, conducting statistical analysis, double data checking, manuscript writing, revising, and submission to a journal. Nevertheless, this is an important outcome that could impact the current practice and promote higher-quality future studies to address evidence gaps.
REFERENCES
[1] G.M. Tawfik, K.A.S. Dila, M.Y.F. Mohamed, D.N.H. Tam, N.D. Kien, A.M. Ahmed, N.T. Huy, A step by step guide for conducting a systematic review and meta-analysis with simulation data, Trop. Med. Health. 47 (2019). https://doi.org/10.1186/s41182-019-0165-6.
[2] A. Shorten, B. Shorten, What is meta-analysis?, Evid. Based. Nurs. 16 (2013). https://doi.org/10.1136/eb-2012-101118.
[3] J.P.T. Higgins, J. Thomas, J. Chandler, M. Cumpston, T. Li, M.J. Page, V.A. Welch, Cochrane handbook for systematic reviews of interventions version 6.2 [updated February 2021], 2021.
[4] M.J. Page, J.E. McKenzie, P.M. Bossuyt, I. Boutron, T.C. Hoffmann, C.D. Mulrow, L. Shamseer, J.M. Tetzlaff, E.A. Akl, S.E. Brennan, R. Chou, J. Glanville, J.M. Grimshaw, A. Hróbjartsson, M.M. Lalu, T. Li, E.W. Loder, E. Mayo-Wilson, S. McDonald, L.A. McGuinness, L.A. Stewart, J. Thomas, A.C. Tricco, V.A. Welch, P. Whiting, D. Moher, The PRISMA 2020 statement: An updated guideline for reporting systematic reviews, BMJ. 372 (2021). https://doi.org/10.1136/bmj.n71.

Ramaiah M is a Manager, Scientific Writing with 14+ years of experience in Scientific Writing and CER Writing. He has a proven track record in developing highly complex manuscripts reporting safety and efficacy data from pivotal clinical studies for publication in highimpact journals as per ICMJE, GPP, EQUATOR, EASE, AMWA, STM, and applicable ethical regulations (COPE).

Balaji. M is a Deputy Manager, Scientific Writing with 12+ years of experience in Scientific Writing. He has a recognized background in developing complex manuscripts in biomedical engineering, drug delivery, biomaterials, and nanotechnology with novel therapeutics to bring advanced medication systems for various unmet medical needs. He has published numerous articles following publication guidelines (ICMJE, GPP, EQUATOR, EASE, AMWA, STM).